Decarbonization Roadmap: How to Build One Step by Step
A decarbonization roadmap is the operational document that turns climate targets into concrete action. It answers a simple question: which measures will the company implement, in what order, with what investment, and toward what target?
What a decarbonization roadmap is
First, a roadmap identifies the company’s most significant emission sources. Next, it evaluates the measures available to reduce them and ranks those measures by cost and impact. Finally, it lays them out on a timeline with owners, budgets, and tracking indicators.
Its main audience is the leadership team. After all, that team decides how to spend the next few years of capital expenditure (CapEx).
How it differs from a climate transition plan
A transition plan is the strategic document. It places the roadmap inside a broader framework: scenarios, governance, value chain commitments, financing, and external communication.
In other words, the roadmap is the operational layer of the plan. It answers the “how,” while the plan answers the “why” and the “where to.” That’s why one without the other is incomplete. A roadmap without a plan is execution without strategy. Conversely, a plan without a roadmap is strategy without execution.
How it differs from an emissions inventory
The emissions inventory is the diagnosis: how much the company emits, from which sources, and in which scopes. The roadmap, by contrast, is the prescription: what to do about that diagnosis. Without source-level data, no one can tell where the real reduction potential lies.
What makes a roadmap strategic
A list of measures is not a roadmap. Installing solar panels, electrifying the fleet, or improving insulation are good ideas, but something is missing. Specifically, they lack what turns ideas into decisions:
- The impact of each measure, quantified in metric tons of CO₂e (tCO₂e)
- The cost per ton reduced
- Technical feasibility in the company’s specific context
- The sequence that maximizes impact with the capital available
In addition, a strategic roadmap answers three questions at once. Which measures have the greatest impact? Which ones make economic sense today? And finally, which depend on conditions that don’t exist yet, but that the company can prepare for?
The starting point: a detailed GHG inventory
Why it needs real data
Every roadmap starts from a baseline: base-year emissions, broken down by source and scope. Without that breakdown, the company can’t see where its reduction potential sits. Nor can it calculate the impact of any specific measure.
A Scope 1 and 2 inventory is the bare minimum. However, in manufacturing, retail, logistics, or financial services, Scope 3 usually makes up most of the footprint. As a result, a roadmap that ignores it leaves out much of the problem. It also misses several of the largest reduction opportunities.
What the inventory feeds into the roadmap
The roadmap draws four inputs from the inventory:
- Emissions by source. This shows where the largest volumes sit: electricity, fleet, process fuels, or purchased goods. In other words, it points to where the most tons are waiting to be cut.
- Intensity profile. This links emissions to activity, such as tCO₂e per unit produced, per mile, or per square foot. With it, the company can project emissions under different growth scenarios.
- Historical trends. These reveal whether emissions have risen, held steady, or fallen, and why. Consequently, projections become more realistic.
- Scope 3 materiality. This identifies which value chain categories concentrate the most emissions. Thus, it shows where supplier programs or product design changes will pay off most.
The marginal abatement cost curve (MACC)
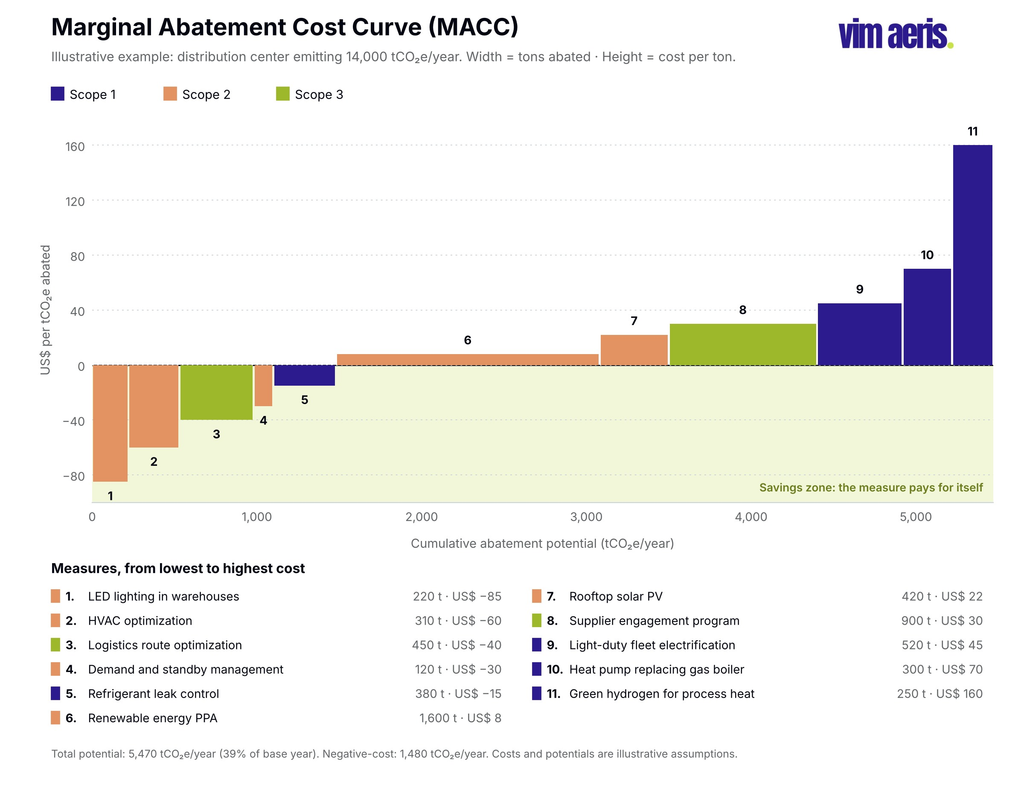
The marginal abatement cost curve, or MACC, is the roadmap’s central tool. It plots two variables for each measure. On the vertical axis, it shows the cost per ton reduced, in dollars per tCO₂e. On the horizontal axis, meanwhile, it shows the total reduction potential, in tCO₂e.
Each measure appears as a bar. The width shows how many tons it can cut, and the height shows what each ton costs. From left to right, the bars run from lowest to highest cost.
The result is a map that answers the most practical question in decarbonization. With a limited budget, where should you invest first to cut the most emissions at the lowest cost?
How to build it: cost per ton vs. reduction potential
For each measure, the company calculates two parameters.
The first is reduction potential: how many tCO₂e the measure removes over its useful life, compared with the status quo. For example, for industrial lighting, the company compares current consumption with that of the new technology. Then it multiplies the difference by the grid emission factor and the equipment’s years of service.
The second is marginal abatement cost: the net present value of the measure’s cost or savings, divided by the tons it cuts. Bars below the horizontal axis have a negative cost, meaning they save money over their lifetime. Bars above the axis, by contrast, carry a net cost.
Often, the MACC reveals negative-cost measures, typically in energy and resource efficiency. These measures cut emissions and operating costs at the same time. That’s why they go first. Higher-cost measures, on the other hand, usually need longer planning cycles, incentives, or partnerships.
Quick wins: measures with a positive financial return
The operating rule is simple: implement the most cost-effective measures first, especially those that save money. Then the company can redirect those savings toward its next climate projects.
In mid-sized companies, the most common negative-cost measures include:
- Optimizing HVAC and lighting systems
- Improving insulation in industrial facilities
- Optimizing logistics routes
- Cutting standby power consumption
- Actively managing energy demand
Many of these pay back their investment within a few years. In addition, their savings can fund the higher-cost measures in the next horizon. In this way, the first stage of decarbonization helps pay for the next ones.
High-cost measures: when and how to tackle them
Some measures carry a positive abatement cost. Examples include electrifying energy-intensive processes, switching to green hydrogen, or capturing carbon at the source. Even so, the company doesn’t discard them because of today’s cost. Instead, it plans them for the medium and long term.
In that horizon, three factors tend to converge. First, technology costs fall as markets scale. Second, carbon prices can rise through regulation, as California’s cap-and-trade program shows. Third, the company has built up the capital or financing access it needs.
Lastly, the MACC is not static. Companies should update it every two to three years to reflect changes in costs, emission factors, and regulation. In fact, those changes can move expensive measures into negative-cost territory.
The most common reduction measures by scope
The MACC sorts measures by cost and impact. This section, instead, sorts them by scope. That way, it’s clear what the company controls directly and what requires working with third parties.
Scope 1: fuels, fleet, refrigerants, and processes
Scope 1 measures target sources the company controls directly. These are the most common:
- Efficiency in fuel-burning equipment. This covers boilers, furnaces, and gas heating, plus better insulation. Typically, its abatement cost is negative or close to zero.
- Replacing fossil fuels in processes. This means swapping fossil boilers for heat pumps, renewable heat, or certified biomass. Its cost varies widely by sector and by the alternatives available locally.
- Electrifying the company fleet. When vehicles switch to electric, their emissions move from Scope 1 to Scope 2. Therefore, the benefit depends on the local grid’s emission factor. In cleaner eGRID subregions, each electric vehicle delivers a larger reduction.
- Controlling refrigerant leaks. Common HFCs have a global warming potential hundreds to thousands of times that of CO₂. For example, HFC-134a has a GWP of about 1,530 under IPCC AR6. Moreover, the EPA’s AIM Act program is phasing down HFCs, so low-GWP alternatives also reduce regulatory risk.
- Process emissions. In cement, steel, or chemicals, these are the hardest and most expensive to cut. They require deep technology changes, which the company must plan for the long term.
Scope 2: renewable energy and demand management
Scope 2 measures target the electricity the company buys. The usual sequence is:
- First, cut consumption. Efficiency in lighting, HVAC, and motors shrinks the electricity left to decarbonize. Thus, a company that uses 20% less power needs 20% less renewable energy for the same result.
- Next, buy renewable energy. Options include physical or virtual power purchase agreements (PPAs), utility green tariffs, and renewable energy certificates (RECs). To reflect these purchases, the company also reports Scope 2 under the market-based method.
- Finally, add on-site generation and storage. The company can install its own solar and, in advanced cases, add batteries. Over the past decade, the cost of both technologies has fallen sharply. Since federal clean energy tax credits narrowed in 2025, state and utility incentives now matter more.
Scope 3: supply chain, logistics, and product use
These measures are the most complex. The reason is that they depend on third parties, such as suppliers, carriers, and customers. Over them, the company has influence but no direct control.
- Supplier engagement program. This includes requiring emissions reporting during supplier onboarding and helping key suppliers build their inventories. It also means adding climate criteria to purchasing decisions. In sectors where Scope 3 dominates, it has the largest potential, though it’s also the slowest.
- Logistics optimization. This covers modal shifts (from air to ocean, or from truck to rail), load consolidation, and route optimization. Because it cuts emissions and costs together, its abatement cost is usually negative or very low.
- Product design. This means lower-carbon materials, longer product life, and easier reuse or recycling. It’s a long-term measure that affects purchased goods and the use of sold products.
- Business travel policy. This limits short-haul flights and favors video calls or low-emission ground travel. Its absolute impact is modest; however, its cost is low and its visibility high.
How to sequence decisions over time
The MACC ranks measures by cost. The timeline, in turn, spreads them over time. To do so, it weighs technical feasibility, asset replacement cycles, and available capital. Together, both views define the real sequence of a decarbonization roadmap.
Short term (0 to 3 years): quick wins and better data
This horizon has two goals. On one hand, it captures the negative- or low-cost measures that cut emissions right away. On the other, it improves data quality, especially for Scope 3, to refine the MACC.
Typical measures include energy efficiency, refrigerant management, basic logistics optimization, and travel policy. All of them pay back quickly and don’t depend on emerging technologies. Plus, none require major CapEx decisions.
Now is also the time to verify the baseline, define KPIs, and set up internal governance. Without that governance, the roadmap risks ending up on a shelf.
Medium term (3 to 7 years): investment and transformation
For most companies, this is where most of the absolute reduction happens. At this stage, measures with significant CapEx come in, aligned with asset replacement cycles. Examples include fleet turnover, facility upgrades, and switching energy suppliers.
Long-term renewable energy contracts, on-site generation, and key supplier programs also belong here. These measures need one to three years of planning. Consequently, the company must make those decisions during the short-term horizon.
Long term (7 years to 2050): deep decarbonization
The third horizon tackles sources that have no affordable solution today. These include energy-intensive process emissions, the deepest tiers of the supply chain, and residual emissions. Those residual emissions will require capture or removal technologies.
By nature, this horizon can’t match the precision of the first two, because technology and policy uncertainty is high. Even so, the company can define the direction today, along with verifiable interim milestones and periodic reviews.
What role carbon offsets play
Offsetting means buying credits that represent emission reductions or removals achieved somewhere else. It’s also the element that causes the most confusion, and the one companies misuse most often.
When offsets make sense, and when they don’t
The technical consensus is clear: offsets are the last resort, not the first. Their legitimate role is to neutralize residual emissions after the company has exhausted its reduction options. Therefore, they should never replace real reductions.
The SBTi takes the same line. Under its V2.0 standard, credits don’t count toward reduction targets. Moreover, from its net-zero target year, a company must neutralize 100% of residual emissions with eligible removals.
On the other hand, a company that buys credits to call itself “carbon neutral” without cutting emissions isn’t decarbonizing. In reality, it’s paying to say that it is. That approach carries growing reputational and legal risk. In California, for example, AB 1305 requires companies that make carbon-neutral claims to disclose how they back them up. Likewise, the FTC’s Green Guides apply to environmental marketing claims nationwide.
In short, offsets belong at the end of the abatement curve. First, the company schedules every viable reduction measure. Only then do offsets cover what remains.
Credit quality: what separates a sound credit from a questionable one
Judging carbon credits requires checking five criteria: additionality, permanence, accurate quantification, independent verification, and co-benefits.
- Additionality. This is the most critical test. A project is additional when it wouldn’t have happened without carbon finance. Otherwise, the company is paying for something that would have happened anyway.
- Permanence. The reduction or removal must last. For example, a reforestation project that loggers clear ten years later doesn’t deliver a permanent reduction. That’s why durable removal credits tend to command higher prices.
- Quantification and verification. The project must measure its tons with robust methodologies, and an independent third party must verify them.
- Co-benefits. The best projects also deliver social or environmental benefits for local communities.
Prices vary widely by project type and quality. Still, an unusually low price is often a warning sign. As a quality benchmark, the voluntary market increasingly relies on the Integrity Council for the Voluntary Carbon Market (ICVCM) Core Carbon Principles, published in 2023.
How the footprint, roadmap, SBTi targets, and transition plan fit together
These four elements form a logical architecture, each with its own role and clear dependencies:
- The emissions inventory is the database. Without it, none of the other elements has rigor.
- SBTi targets set the ambition. They define how much the company must cut and by when, consistent with climate science. To validate them, the SBTi requires a solid inventory. In fact, under V2.0, Category A companies must also obtain assurance of their base-year data.
- The roadmap shows how to get there. It defines what to do, in what order, at what cost, and with what impact. As a result, it becomes the main technical input to the transition plan.
- The transition plan provides the strategic frame. It explains how the business model will evolve, how the company will fund the shift, and how it will manage climate risk. It also defines how to communicate all of this to investors, regulators, and the value chain.
Built in that order, the four elements give the company a coherent, auditable climate architecture.
Common mistakes that make a roadmap useless
Building it without a detailed inventory
Without source-level data, no one can calculate a measure’s reduction potential. Nor is it possible to build a MACC on a solid base. The result is a list of reasonable measures with no way to prioritize them.
Prioritizing visibility over impact
Installing solar panels at headquarters makes for great sustainability report photos. However, if headquarters accounts for 3% of emissions and the fleet for 40%, the priority is the fleet. The MACC prevents this mistake, because it puts tons and costs at the center of the decision.
Leaving out Scope 3
In many sectors, limiting the roadmap to Scopes 1 and 2 leaves out most of the footprint. Admittedly, measuring Scope 3 is complex. Still, the main frameworks allow companies to start with documented estimates.
Treating the MACC as a static document
Technology costs change, grid emission factors evolve, and regulation moves forward. For that reason, a 2022 MACC that no one has revisited may recommend priorities that no longer reflect reality.
Failing to connect it to CapEx decisions
This is the most common mistake among companies that have a roadmap but aren’t making progress. The document lives with the sustainability team and never reaches capital planning. Unless its measures compete with other investments, in the same language of return and risk, they will stay on paper.
Using offsets instead of reductions
Offsetting at the start of the curve, before exhausting reduction measures, isn’t decarbonization. At best, it only postpones the problem.
How Vim Aeris supports you
Every decarbonization roadmap starts with the emissions inventory. That’s why Vim Aeris supports U.S. companies from the initial measurement onward. From there, it builds the abatement curve and the complete roadmap with each client.
The work includes identifying sources, quantifying each measure’s potential, and analyzing its abatement cost. It also includes sequencing measures by horizon and defining tracking KPIs.
For companies pursuing SBTi validation or a transition plan, Vim Aeris integrates all three elements into a single process. This way, the company avoids duplicated work and disconnected documents.
Frequently asked questions
How long does it take to build a decarbonization roadmap? It depends mainly on whether an inventory already exists. With a verified inventory and organized data, the process takes six to twelve weeks. That estimate applies to a mid-sized company operating in a single country. Without a prior inventory, by contrast, the full process can take four to six months.
Does the roadmap have to cover Scope 3? There’s no universal requirement. However, leaving it out makes the roadmap incomplete in most sectors. The SBTi also requires it in many cases. Under the criteria in force through 2027, a Scope 3 target is mandatory when Scope 3 exceeds 40% of total emissions. From 2028, under V2.0, Category A companies must cover every category that makes up at least 5% of Scope 3.
How often should you update it? Standard practice is to review progress against KPIs every year. In addition, companies should update the MACC every two to three years. They should also update it after major changes, such as acquisitions, divestitures, or shifts in the product mix.
Can a small company build one without outside consultants? Yes, especially for Scopes 1 and 2. The GHG Protocol’s tools and sector guidance offer a good starting point. With them, an internal team with basic technical skills can build an inventory and a simplified MACC. A consultant adds value elsewhere. For example, it helps identify less obvious measures and brings cost data by technology and market. It also connects the roadmap to external frameworks such as the SBTi or SB 253.
What if the company can’t fund every measure? The roadmap doesn’t commit the company to doing everything at once. Rather, it’s a prioritization tool. Having the full curve lets the company decide where to put its available capital first. At the same time, it makes clear what remains for later. Finally, several of the highest-impact measures have a negative cost. In other words, they pay for themselves through the savings they generate.
Start your company’s climate action today
Email us at sales@vim-aeris.com or schedule a meeting with the Director of Vim Aeris.